From One Guy Who Doesn’t Want to Buy Another Car Window
My car was broken into twice in Fairmount. Both times the window got smashed. Then this summer — nothing. The 9th District weekly report explains why.
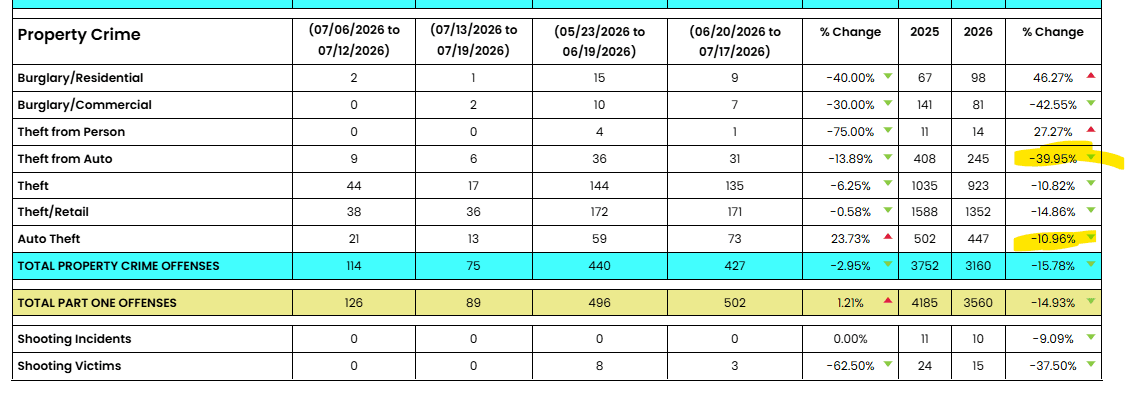
My car was broken into twice over the last couple of years in Fairmount.
The first time was near Roberto Clemente Park. The second was literally a few feet from my front door. Neither time they got much — just a USB phone charger and about 50 cents in Aldi quarter money — but both times they smashed a window.
Each time the bill ran several hundred dollars — the car still ran, the window did not. The haul was fifty cents and a phone charger; the damage was a $500 window. You pay it, you park on the same street, and you tell yourself it’s the cost of living in the city.
The second one was especially stressful because they shattered the rear window a week before my son was born. Glass got into the infant car seat, so I had to replace it before we could even bring him home from the hospital.
You walk out to the car the next morning and you see the broken glass on the sidewalk, and your first thought is — fine, this is annoying, this is the cost of living in a city. Your second thought is the back seat, the car seat, and whether anything is going to be OK. It was not OK. We replaced the car seat. We brought him home. We moved on.
We moved on — but every time I went out to the car for the next week I thought about it. I thought about how the person who did it almost certainly did not know a baby was about to come home to that seat. Or maybe they did know, and they did it anyway. I do not think I will ever know which.
This summer, though…nothing. Walking around Fairmount and Center City — out to Roberto Clemente with my son, down Spring Garden, along the river past the art museum — I have noticed a lot less broken glass on the sidewalks; the curbs and the corners under the streetlights look cleaner, and the whole neighborhood has a different feel to it on a Saturday morning when you walk the dog.
I figured maybe it was just my perception, so I looked at the police district statistics.
According to the latest Philadelphia Police Department 9th District weekly report (as of 07/17/2026, year-to-date through that date):
Theft from auto down 40% year over year. Total property crime down 16% year over year. Total violent crime down 8%. Two homicides year-to-date, down 33% from the same period last year.
Whatever combination is doing it, I wanted to see the numbers. And one thing jumped out — the drop is not even across property crime. Theft from auto is down 40%. Other theft is down 10%. So this is not a generic citywide getting-safer story. Something specific happened, and it shows up most clearly in the thing that broke my car window.
I do not know why. I had not been watching the district pages; I only started looking because this summer felt different. The 9th District covers a big chunk of the city — Center City, Fairmount, Brewerytown, Spring Garden, Callowhill, Old City, Northern Liberties, and the smaller blocks tucked between them, north of Lombard and south of Poplar. Tourists walk here and residents live here, mixed together, and whatever is happening is happening in a place with a lot of eyes on it.
The theft-from-auto number is the one that surprised me the most. I had expected the property crime drop to be roughly even across categories; instead it is concentrated on the one that hits people who park on the street and walk away. A few things could be doing it — security cameras on residential blocks, car alarms that actually trigger and bring someone out of a townhouse, license-plate readers that change the risk calculation. I do not know which is the largest contributor, and the report does not say, but the result is the most peaceful summer on my block in three years.
So, thank you to everyone who has played a part — from police officers to community groups to City Hall. From anti-poverty programs to the residents who keep showing up. From one guy who would rather not spend another $500 replacing a smashed window, I appreciate it.
The job of doing this kind of work, day in day out, without anyone noticing — that’s what I wrote about in The Job No One Wants. The traffic stops that end with a warning, the motorcycle cops who let a five-month-old sit on the handlebars, the night shift that just keeps showing up. The numbers above come from one district, one summer, but the people behind them are doing the same thankless middle across the whole city.
Notes, Sources, and Methodology
The numbers come from the Philadelphia Police Department 9th District weekly crime statistics page, dated 07/17/2026. YTD means year-to-date through that date. The chart above is the property crime portion of that report; the violent crime figures (total violent crime and homicide) come from the same weekly report but are not pictured.
Methodology. Year-over-year changes compare 2026 YTD through 07/17 against 2025 YTD through the same date. The 9th District covers Center City, Fairmount, Brewerytown, Spring Garden, Callowhill, Old City, Northern Liberties, and adjacent neighborhoods south of Poplar and north of Lombard. The personal anecdote in this article is mine; the data points are public.
Limitations. This is one district, one week — the report does not tell anyone why the drop, only that it is there. The differential between theft from auto (−40%) and other theft (−10%) is in the source data but is not explained by the report itself. The article is gratitude, not an investigation.